
How it works
The knowledge graph — your company's knowledge as a map
The Knowledge graph page has two ways of looking. KNOWLEDGE — the default — draws what the documents actually know: the people, organisations, projects, places, events and ideas they talk about, joined by the relations the documents themselves state — who works for whom, who pays whom, what caused what. Every node and thread carries its evidence: click anything and the documents behind it are one tap away. SOURCES & ACCESS is the structural picture underneath: sources, documents, groups and who-may-read-what. Both are pictures of the index, not a separate system — they redraw from the real data and change nothing about how answers are found.
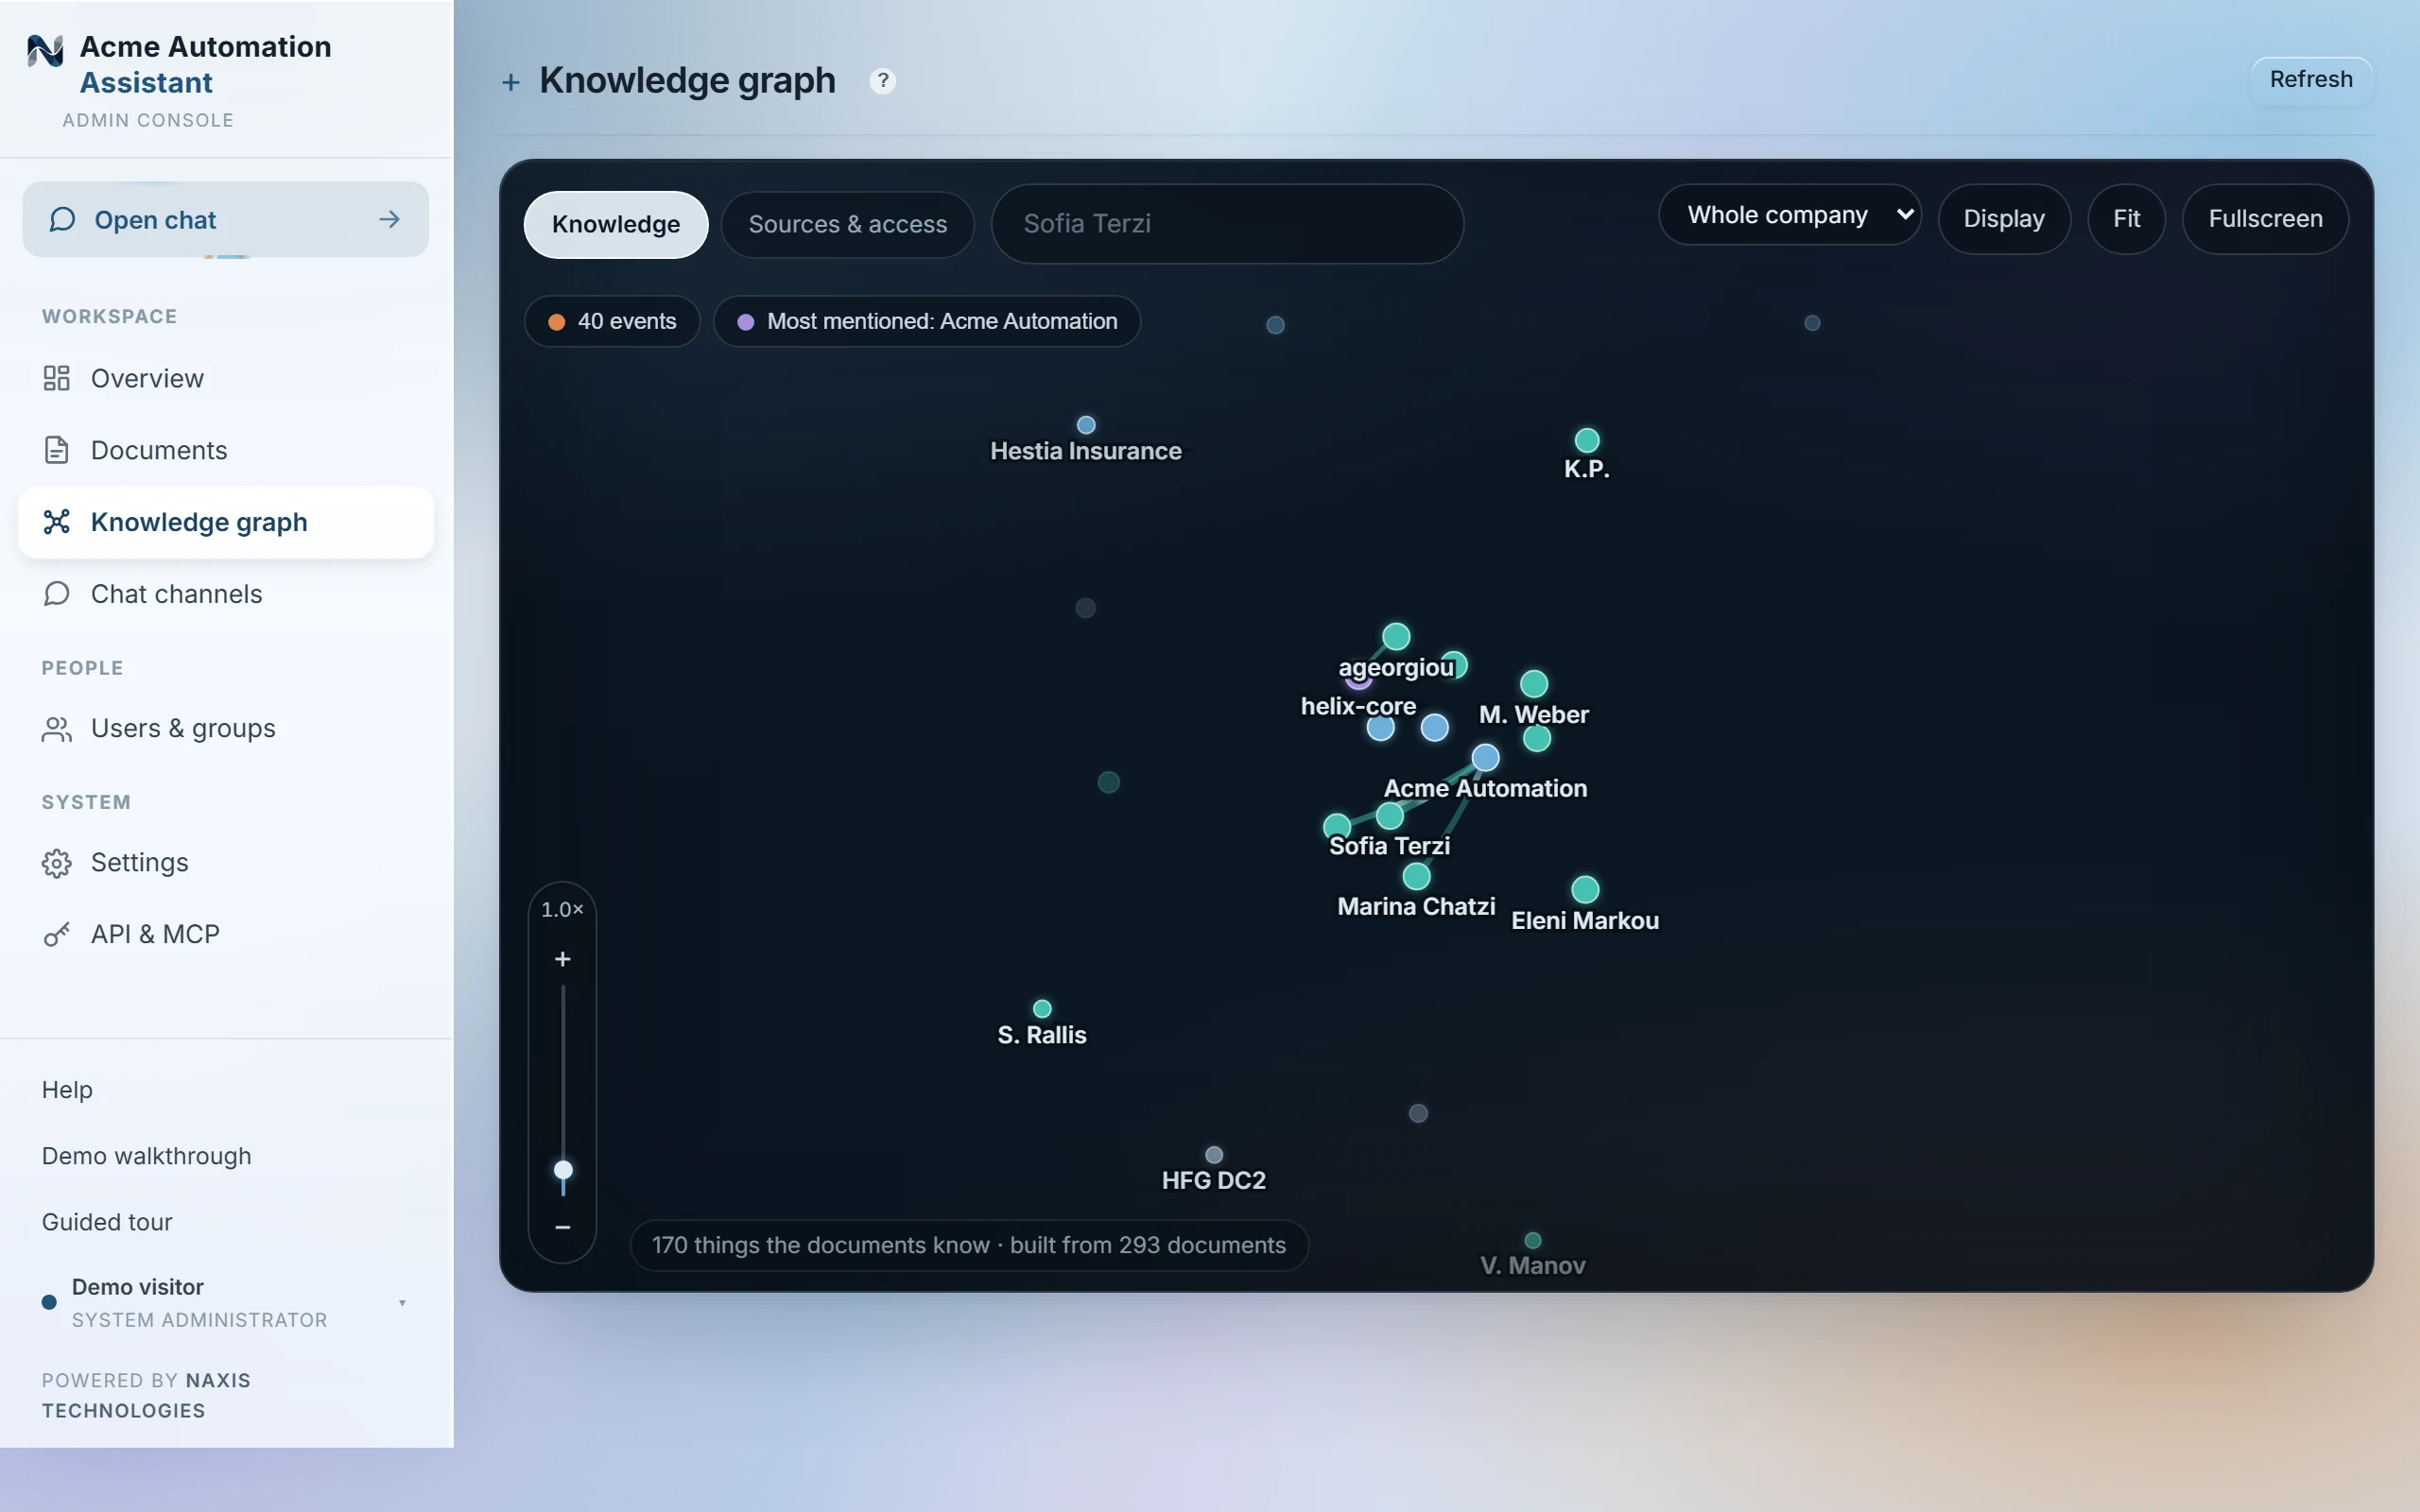
Reading the Knowledge view
| Colours are types | Teal people, steel-blue organisations, copper events (a second ring marks a thing that HAPPENED), violet projects, slate places, green things & ideas. Size is how many documents mention it. |
|---|---|
| Threads are relations | Each colour is a kind — caused, resolved, works for, supplies, pays, decided… Hover any thread and it says its sentence: “X caused Y · 4 documents”. Light travels ALONG a directed thread, from the actor to the acted-upon — you can watch what caused what. Dotted grey threads just mean “appear together”. |
| The inspector | Click anything: its type, how many documents mention it, its connections (each one a click), and the documents themselves — the evidence — opening right there. |
| One name per thing | The same real-world thing under different names — shortenings, initials, legal suffixes, even translations — is recognised at analysis time and shown as ONE node, with every spelling kept as evidence. Two people who merely share a name are never merged. |
| The knowledge grows in | Types and relations come from the document analysis that runs in the background; on a fresh corpus the map starts plain and sharpens as documents are read. A chip on the stage counts the documents still in the queue. Very large libraries are paced — if the queue runs long, the chip says so and opens a support ticket to raise the pace for your deployment. |
Reading Sources & access
| Sources | The big steel-blue anchors. Size follows how many documents each holds. |
|---|---|
| Documents | The detail layer — zoom in and they materialise around their source; a copper core marks a document NOT readable by everyone. |
| Groups & people | Who belongs to which group, which groups reach which documents, where guests come in — the restricted-documents chip is a one-click audit lens. |
One person's view
Pick a person in the selector and the map redraws as THAT person's world: only the documents their access reaches, only the groups that touch them. It is the same live preview the access rules produce everywhere else — a one-glance answer to “what would one person see?”, before you trust a new group setup.
Working the map
- Click anything to inspect it: the panel shows what it is, who can read it, and everything it connects to — each connection a click that glides you there.
- Zoom (scroll or pinch) to surface the documents; Fit returns to the whole map; drag anything to rearrange.
- Search finds any document, topic or person by name and flies to it.
- The chips over the map are live facts: the restricted count filters to exactly those documents; the biggest topic takes you to it. Display chooses what kinds of nodes and threads show.
- On a very large index the map holds the newest documents and says so — the count in the corner is always honest.
Admins see the whole company's map; a person's view shows their access, which admins can already inspect under Users. The graph is also available to a connected assistant over MCP (get_knowledge_graph, with an admin key) — the same tool can ask for one person's view or one group's view instead of the whole company's.
Last updated 22 Sep 2026